spacepy.toolbox.hypot
- spacepy.toolbox.hypot(*args)[source]
compute the N-dimensional hypot of an iterable or many arguments
- Parameters:
- argsmany numbers or array-like
array like or many inputs to compute from
- Returns:
- outfloat
N-dimensional hypot of a number
Notes
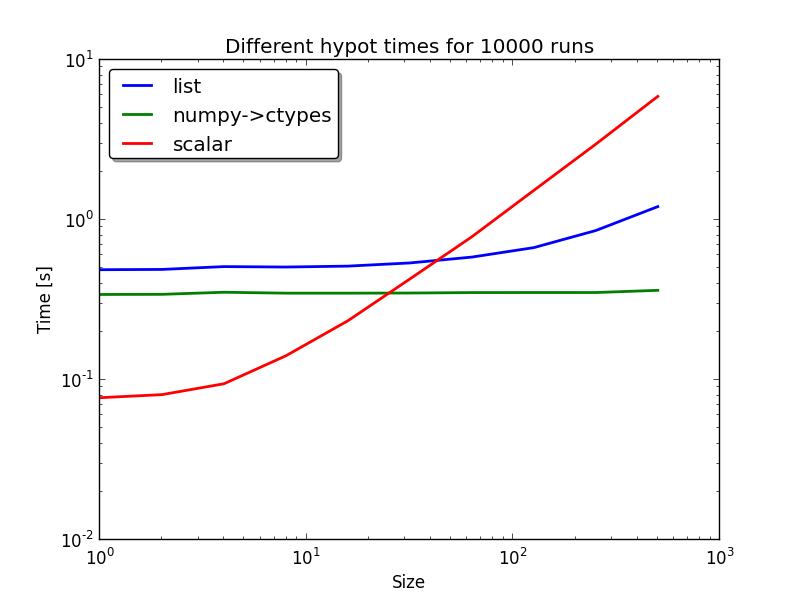
- This function has a complicated speed function.
if a numpy array of floats is input this is passed off to C
if iterables are passed in they are made into numpy arrays and comptaton is done local
if many scalar agruments are passed in calculation is done in a loop
- For max speed:
- <20 elements expand them into scalars
>>> tb.hypot(*vals)
>>> tb.hypot(vals[0], vals[1]...) #alternate
>20 elements premake them into a numpy array of doubles
Examples
>>> from spacepy import toolbox as tb
>>> print tb.hypot([3,4])
5.0
>>> print tb.hypot(3,4)
5.0
>>> # Benchmark ####
>>> from spacepy import toolbox as tb
>>> import numpy as np
>>> import timeit
>>> num_list = []
>>> num_np = []
>>> num_np_double = []
>>> num_scalar = []
>>> tot = 500
>>> for num in tb.logspace(1, tot, 10):
>>>     print num
>>>     num_list.append(timeit.timeit(stmt='tb.hypot(a)',
                        setup='from spacepy import toolbox as tb;
                        import numpy as np; a = [3]*{0}'.format(int(num)), number=10000))
>>>     num_np.append(timeit.timeit(stmt='tb.hypot(a)',
                      setup='from spacepy import toolbox as tb;
                      import numpy as np; a = np.asarray([3]*{0})'.format(int(num)), number=10000))
>>>     num_scalar.append(timeit.timeit(stmt='tb.hypot(*a)',
                          setup='from spacepy import toolbox as tb;
                          import numpy as np; a = [3]*{0}'.format(int(num)), number=10000))
>>> from pylab import *
>>> loglog(tb.logspace(1, tot, 10),  num_list, lw=2, label='list')
>>> loglog(tb.logspace(1, tot, 10),  num_np, lw=2, label='numpy->ctypes')
>>> loglog(tb.logspace(1, tot, 10),  num_scalar, lw=2, label='scalar')
>>> legend(shadow=True, fancybox=1, loc='upper left')
>>> title('Different hypot times for 10000 runs')
>>> ylabel('Time [s]')
>>> xlabel('Size')