spacepy.toolbox.bootHisto
- spacepy.toolbox.bootHisto(data, inter=90.0, n=1000, seed=None, plot=False, target=None, figsize=None, loc=None, **kwargs)[source]
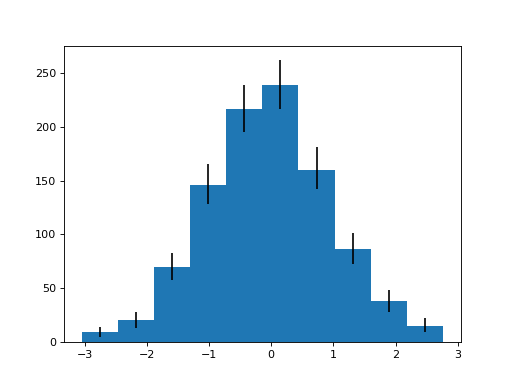
Bootstrap confidence intervals for a histogram.
All other keyword arguments are passed to
numpy.histogram()ormatplotlib.pyplot.bar().Changed in version 0.2.3: This argument pass-through did not work in earlier versions of SpacePy.
- Parameters:
- dataarray_like
list/array of data values
- interfloat (optional; default 90)
percentage confidence interval to return. Default 90% (i.e. lower CI will be 5% and upper will be 95%)
- nint (optional; default 1000)
number of bootstrap iterations
- seedint (optional)
Optional seed for the random number generator. If not specified; numpy generator will not be reseeded.
- plotbool (optional)
Plot the result. Plots if True or
target,figsize, orlocspecified.- target(optional)
Target on which to plot the figure (figure or axes). See
spacepy.plot.utils.set_target()for details.- figsizetuple (optional)
Passed to
spacepy.plot.utils.set_target().- locint (optional)
Passed to
spacepy.plot.utils.set_target().
- Returns:
- outtuple
tuple of bin_edges, low, high, sample[, bars]. Where
bin_edgesis the edges of the bins used;lowis the histogram with the value for each bin from the bottom of that bin’s confidence interval;highsimilarly for the top;sampleis the histogram of the input sample without resampling. If plotting, also returned isbars, the container object returned from matplotlib.
See also
binHistoplot.utils.set_targetnumpy.histogrammatplotlib.pyplot.hist
Notes
New in version 0.2.1.
The confidence intervals are calculated for each bin individually and thus the resulting low/high histograms may not have actually occurred in the calculation from the surrogates. If using a probability density histogram, this can have “interesting” implications for interpretation.
Examples
>>> import numpy.random
>>> import spacepy.toolbox
>>> numpy.random.seed(0)
>>> data = numpy.random.randn(1000)
>>> bin_edges, low, high, sample, bars = spacepy.toolbox.bootHisto(
...     data, plot=True)
(
Source code,png,hires.png,pdf)