spacepy.plot.utils
Utility routines for plotting and related activities
Authors: Jonathan Niehof, Steven Morley, Daniel Welling
Institution: Los Alamos National Laboratory
Contact: jniehof@lanl.gov
Copyright 2012-2014 Los Alamos National Security, LLC.
Functions
|
Add directional arrows along a plotted line. |
|
Add an image (logo) to one corner of a plot. |
|
Write text in-line and to the right of the x-axis tick labels |
|
Given an axis ax and a list/array of datetime objects, time, use the smartTimeTicks function to build smart time ticks and then immediately apply them to the given axis. |
|
Collapse the vertical spacing between two or more subplots. |
|
From a list of boxes, exclude those that are completely contained by another |
|
Given a list of boxes with clear space, figure aspect ratio (width/height), and image aspect ratio (width/height), return the largest clear space that maintains the aspect ratio of the image |
|
Take a list of boxes which obstruct the plot, i.e., don't overplot |
|
Go through all elements of a figure and find the "boxes" they occupy, in figure coordinates. |
|
save current figure to file and call lpr (print). |
|
Given a target on which to plot a figure, determine if that target is None or a matplotlib figure or axes object. |
|
Create a ylabel that spans several subplots |
|
Show the areas of a figure which are used/occupied by plot elements. |
|
Returns major ticks, minor ticks and format for time-based plots |
|
print a timestamp on the current plot, vertical lower right |
Classes
|
Presents a provided figure (normally a time series) and provides an interface to mark events shown in the plot. |
- spacepy.plot.utils.add_arrows(lines, n=3, size=12, style='->', dorestrict=False, positions=False)[source]
Add directional arrows along a plotted line. Useful for plotting flow lines, magnetic field lines, or other directional traces.
lines can be either
Line2D, a list or tuple of lines, or aLineCollectionobject.For each line, arrows will be added using
annotate(). Arrows will be spread evenly over the line using the number of points in the line as the metric for spacing. For example, if a line has 120 points and 3 arrows are requested, an arrow will be added at point number 30, 60, and 90. Arrow color and alpha is obtained from the parent line.- Parameters:
- lines
Line2D, a list/tuple, orLineCollection A single line or group of lines on which to place the arrows. Arrows inherent color and transparency (alpha) from the line on which they are placed.
- lines
- Returns:
- None
- Other Parameters:
- ninteger
Number of arrows to add to each line; defaults to 3.
- sizeinteger
The size of the arrows in points. Defaults to 12.
- stylestring
Set the style of the arrow via
ArrowStyle, e.g. ‘->’ (default)- dorestrictboolean
If True (default), only points along the line within the current limits of the axes will be considered when distributing arrows.
- positionsNx2 array
N must be the number of lines provided via the argument lines. If provided, only one arrow will be placed per line. positions sets the explicit location of each arrow for each line as X-Y space in Axes coordinates.
Notes
The algorithm works by dividing the line in to n*+1 segments and placing an arrow between each segment, endpoints excluded. Arrows span the shortest distance possible, i.e., two adjacent points along a line. For lines that are long spatially but sparse in points, the arrows will have long tails that may extend beyond axes bounds. For explicit positions, the arrow is placed at the point on the curve closest to that position and the exact position is not always attainable. A maximum number of arrows equal to one-half of the number of points in a line per line will be created, so not all lines will receive *n arrows.
Examples
>>> import matplotlib.pyplot as plt
>>> import numpy as np
>>> x = np.arange(1, 10, .01)
>>> y = np.sin(x)
>>> line = plt.plot(x,y)
>>> add_arrows(line, n=15, style='-|>')
- spacepy.plot.utils.add_logo(img, fig=None, pos='br', margin=0.05)[source]
Add an image (logo) to one corner of a plot.
The provided image will be placed in a corner of the plot and sized to maintain its aspect ratio and be as large as possible without overlapping any existing elements of the figure. Thus this should be the last call in constructing a figure.
- Parameters:
- imgstr or numpy.ndarray
The image to place on the figure. If a string, assumed to be a filename to be read with
imread(); if a numpy array, assumed to be the image itself (in a simliar format).
- Returns:
- Other Parameters:
- figmatplotlib.figure.Figure
The figure on which to place the logo; if not specified, the
gcf()function will be used.- posstr
The position to place the logo. br: bottom right; bl: bottom left; tl: top left; tr: top right
- marginfloat
Margin to include on each side of figure, as a fraction of the larger dimension of the figure (width or height). Default is 0.05 (5%).
Notes
Calls
draw()to ensure locations are up to date.Examples
>>> import spacepy.plot.utils
>>> import matplotlib.pyplot as plt
>>> fig = plt.figure()
>>> ax0 = fig.add_subplot(211)
>>> ax0.plot([1, 2, 3], [1, 2, 1])
[<matplotlib.lines.Line2D at 0x00000000>]
>>> ax1 = fig.add_subplot(212)
>>> ax1.plot([1, 2, 3], [2, 1, 2])
[<matplotlib.lines.Line2D at 0x00000000>]
>>> spacepy.plot.utils.add_logo('logo.png', fig)
(<matplotlib.axes.Axes at 0x00000000>,
 <matplotlib.image.AxesImage at 0x00000000>)
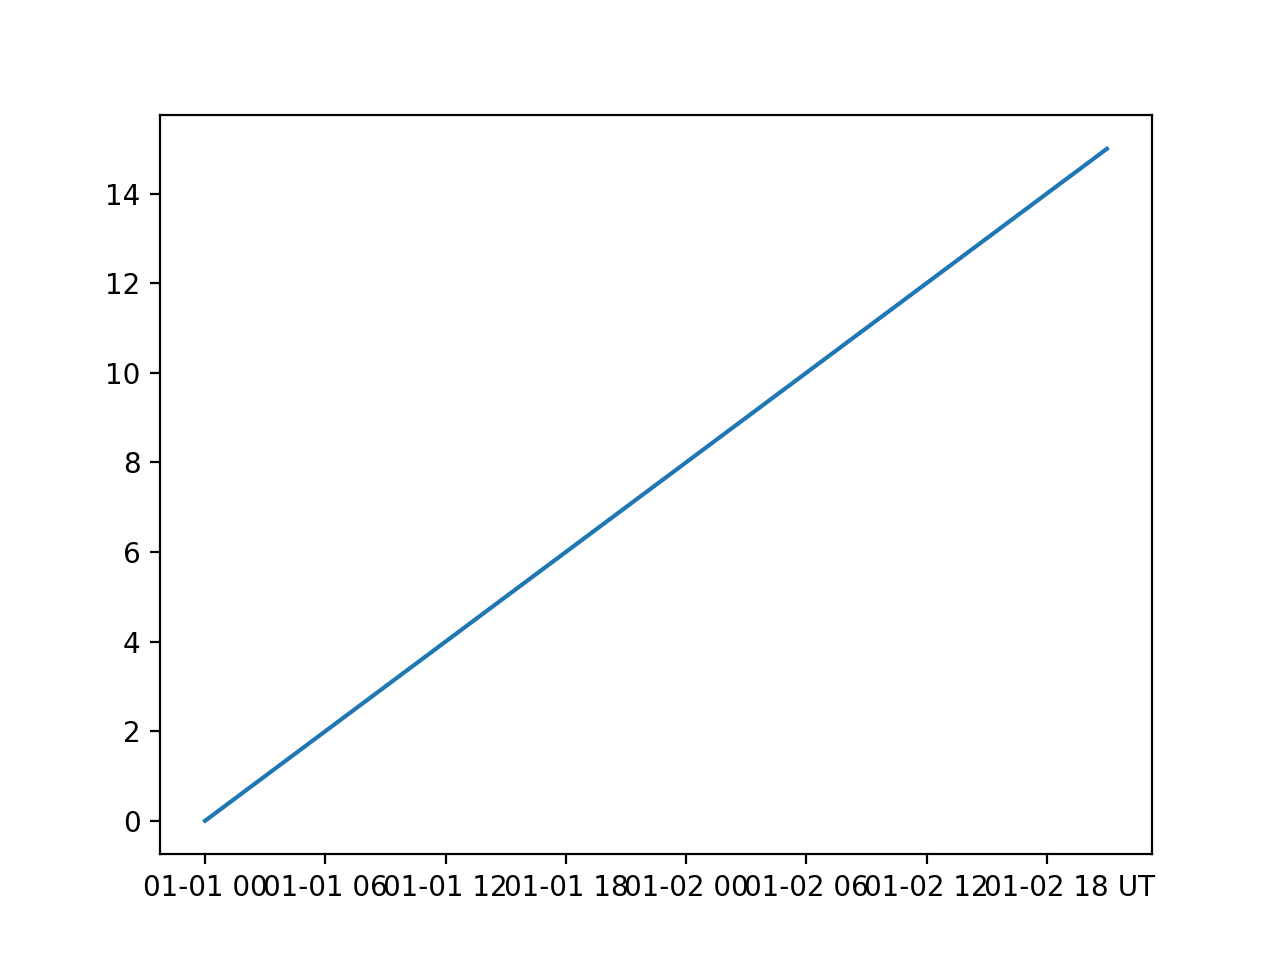
- spacepy.plot.utils.annotate_xaxis(txt, ax=None)[source]
Write text in-line and to the right of the x-axis tick labels
Annotates the x axis of an
Axesobject with text placed in-line with the tick labels and immediately to the right of the last label. This is formatted to match the existing tick marks.- Parameters:
- txtstr
The annotation text.
- Returns:
- outmatplotlib.text.Text
The
Textobject for the annotation.
- Other Parameters:
- axmatplotlib.axes.Axes
The axes to annotate; if not specified, the
gca()function will be used.
Notes
The annotation is placed immediately to the right of the last tick label. Generally the first character of
txtshould be a space to allow some room.Calls
draw()to ensure tick marker locations are up to date.Examples
>>> import spacepy.plot.utils
>>> import matplotlib.pyplot as plt
>>> import datetime
>>> times = [datetime.datetime(2010, 1, 1) + datetime.timedelta(hours=i)
...     for i in range(0, 48, 3)]
>>> plt.plot(times, range(16))
[<matplotlib.lines.Line2D object at 0x0000000>]
>>> spacepy.plot.utils.annotate_xaxis(' UT') #mark that times are UT
<matplotlib.text.Text object at 0x0000000>
(
Source code,png,hires.png,pdf)
- spacepy.plot.utils.applySmartTimeTicks(ax, time, dolimit=True, dolabel=False)[source]
Given an axis ax and a list/array of datetime objects, time, use the smartTimeTicks function to build smart time ticks and then immediately apply them to the given axis. The first and last elements of the time list will be used as bounds for the x-axis range.
The range of the time input value will be used to set the limits of the x-axis as well. Set kwarg ‘dolimit’ to False to override this behavior.
- Parameters:
- axmatplotlib.pyplot.Axes
A matplotlib Axis object.
- timelist
list of datetime objects
- dolimitboolean (optional)
The range of the time input value will be used to set the limits of the x-axis as well. Setting this overrides this behavior.
- dolabelboolean (optional)
Sets autolabeling of the time axis with “Time from” time[0]
See also
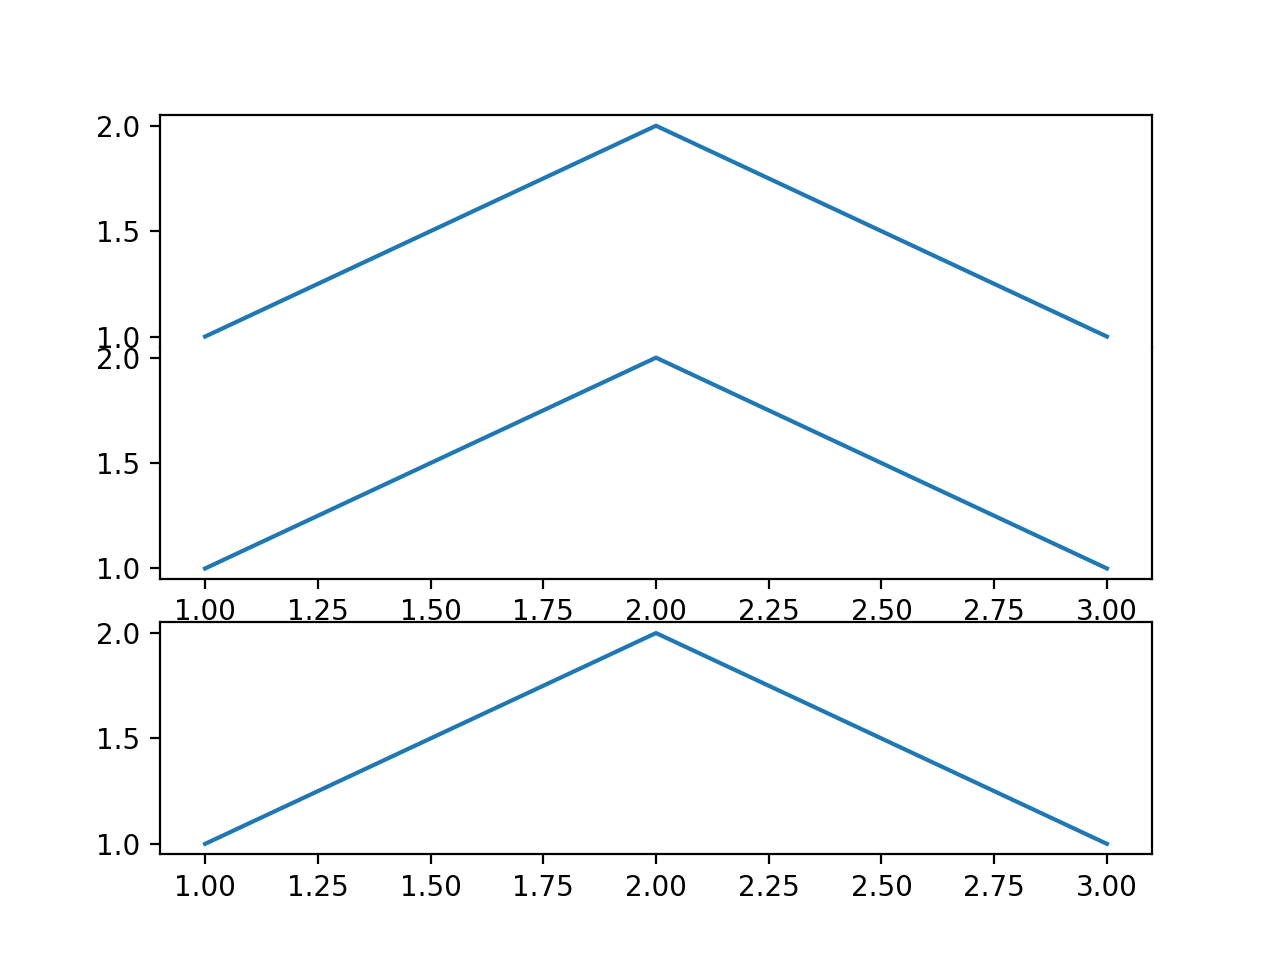
- spacepy.plot.utils.collapse_vertical(combine, others=(), leave_axis=False)[source]
Collapse the vertical spacing between two or more subplots.
Useful for a multi-panel plot where most subplots should have space between them but several adjacent ones should not (i.e., appear as a single plot.) This function will remove all the vertical space between the subplots listed in
combineand redistribute the space between all of the subplots in bothcombineandothersin proportion to their current size, so that the relative size of the subplots does not change.- Parameters:
- combinesequence
The
Axesobjects (i.e. subplots) which should be placed together with no vertical space.
- Other Parameters:
- otherssequence
The
Axesobjects (i.e. subplots) which will keep their vertical spacing, but will be expanded with the space taken away from between the elements ofcombine.- leave_axisbool
If set to true, will leave the axis lines and tick marks between the collapsed subplots. By default, the axis line (“spine”) is removed so the two subplots appear as one.
Notes
This function can be fairly fragile and should only be used for fairly simple layouts, e.g., a one-column multi-row plot stack.
This may require some clean-up of the y axis labels, as they are likely to overlap.
Examples
>>> import spacepy.plot.utils
>>> import matplotlib.pyplot as plt
>>> fig = plt.figure()
>>> #Make three stacked subplots
>>> ax0 = fig.add_subplot(311)
>>> ax1 = fig.add_subplot(312)
>>> ax2 = fig.add_subplot(313)
>>> ax0.plot([1, 2, 3], [1, 2, 1]) #just make some lines
[<matplotlib.lines.Line2D object at 0x0000000>]
>>> ax1.plot([1, 2, 3], [1, 2, 1])
[<matplotlib.lines.Line2D object at 0x0000000>]
>>> ax2.plot([1, 2, 3], [1, 2, 1])
[<matplotlib.lines.Line2D object at 0x0000000>]
>>> #Collapse space between top two plots, leave bottom one alone
>>> spacepy.plot.utils.collapse_vertical([ax0, ax1], [ax2])
(
Source code,png,hires.png,pdf)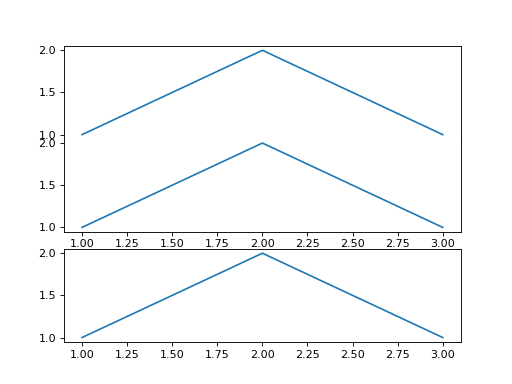
- spacepy.plot.utils.filter_boxes(boxes)[source]
From a list of boxes, exclude those that are completely contained by another
- spacepy.plot.utils.get_biggest_clear(boxes, fig_aspect=1.0, img_aspect=1.0)[source]
Given a list of boxes with clear space, figure aspect ratio (width/height), and image aspect ratio (width/height), return the largest clear space that maintains the aspect ratio of the image
Mostly a helper for add_logo
- spacepy.plot.utils.get_clear(boxes, pos='br')[source]
Take a list of boxes which obstruct the plot, i.e., don’t overplot
Return a list of boxes which are “clear”.
Mostly a helper for add_logo
pos is where to look for the clear area: br: bottom right bl: bottom left tl: top left tr: top right
- spacepy.plot.utils.get_used_boxes(fig=None)[source]
Go through all elements of a figure and find the “boxes” they occupy, in figure coordinates. Mostly helper for add_logo
- spacepy.plot.utils.printfig(fignum, saveonly=False, pngonly=False, clean=False, filename=None)[source]
save current figure to file and call lpr (print).
This routine will create a total of 3 files (png, ps and c.png) in the current working directory with a sequence number attached. Also, a time stamp and the location of the file will be imprinted on the figure. The file ending with c.png is clean and no directory or time stamp are attached (good for PowerPoint presentations).
- Parameters:
- fignuminteger
matplotlib figure number
- saveonlyboolean (optional)
True (don’t print and save only to file) False (print and save)
- pngolnyboolean (optional)
True (only save png files and print png directly) False (print ps file, and generate png, ps; can be slow)
- cleanboolean (optional)
True (print and save only clean files without directory info) False (print and save directory location as well)
- filenamestring (optional)
None (If specified then the filename is set and code does not use the sequence number)
Examples
>>> import spacepy.plot.utils
>>> import matplotlib.pyplot as plt
>>> p = plt.plot([1,2,3],[2,3,2])
>>> spacepy.plot.utils.printfig(1, pngonly=True, saveonly=True)
- spacepy.plot.utils.set_target(target, figsize=None, loc=None, polar=False)[source]
Given a target on which to plot a figure, determine if that target is None or a matplotlib figure or axes object. Based on the type of target, a figure and/or axes will be either located or generated. Both the figure and axes objects are returned to the caller for further manipulation. This is used in nearly all add_plot-type methods.
- Parameters:
- targetobject
The object on which plotting will happen.
- Returns:
- figobject
A matplotlib figure object on which to plot.
- axobject
A matplotlib subplot object on which to plot.
- Other Parameters:
- figsizetuple
A two-item tuple/list giving the dimensions of the figure, in inches. Defaults to Matplotlib defaults.
- locinteger
The subplot triple that specifies the location of the axes object. Defaults to matplotlib default (111).
- polarbool
Set the axes object to polar coodinates. Defaults to False.
Examples
>>> import matplotlib.pyplot as plt
>>> from spacepy.pybats import set_target
>>> fig = plt.figure()
>>> fig, ax = set_target(target=fig, loc=211)
Create a ylabel that spans several subplots
Useful for a multi-panel plot where several subplots have the same units/quantities on the y axis.
- Parameters:
- Returns:
- outmatplotlib.text.Text
The
Textobject for the label.
- Other Parameters:
- Additional arguments and keywords are passed through to
- :meth:`~matplotlib.axes.Axes.set_ylabel`
Notes
This function can be fairly fragile and should only be used for fairly simple layouts, e.g., a one-column multi-row plot stack.
The label is associated with the bottommost subplot in
axes.Examples
>>> import spacepy.plot.utils
>>> import matplotlib.pyplot as plt
>>> fig = plt.figure()
>>> #Make three stacked subplots
>>> ax0 = fig.add_subplot(311)
>>> ax1 = fig.add_subplot(312)
>>> ax2 = fig.add_subplot(313)
>>> ax0.plot([1, 2, 3], [1, 2, 1]) #just make some lines
[<matplotlib.lines.Line2D object at 0x0000000>]
>>> ax1.plot([1, 2, 3], [1, 2, 1])
[<matplotlib.lines.Line2D object at 0x0000000>]
>>> ax2.plot([1, 2, 3], [1, 2, 1])
[<matplotlib.lines.Line2D object at 0x0000000>]
>>> #Create a green label across all three axes
>>> spacepy.plot.utils.shared_ylabel([ax0, ax1, ax2],
... 'this is a very long label that spans all three axes', color='g')
- spacepy.plot.utils.show_used(fig=None)[source]
Show the areas of a figure which are used/occupied by plot elements.
This function will overplot each element of a plot with a rectangle showing the full bounds of that element, to see for example the margins and such used by a text label.
- Returns:
- boxeslist of Rectangle
The
Rectangleobjects used for the overplot.
- Other Parameters:
- figmatplotlib.figure.Figure
The figure to mark up; if not specified, the
gcf()function will be used.
Notes
Calls
draw()to ensure locations are up to date.Examples
>>> import spacepy.plot.utils
>>> import matplotlib.pyplot as plt
>>> fig = plt.figure()
>>> ax0 = fig.add_subplot(211)
>>> ax0.plot([1, 2, 3], [1, 2, 1])
[<matplotlib.lines.Line2D at 0x00000000>]
>>> ax1 = fig.add_subplot(212)
>>> ax1.plot([1, 2, 3], [2, 1, 2])
[<matplotlib.lines.Line2D at 0x00000000>]
>>> spacepy.plot.utils.show_used(fig)
[<matplotlib.patches.Rectangle at 0x0000000>,
 <matplotlib.patches.Rectangle at 0x0000000>,
 <matplotlib.patches.Rectangle at 0x0000000>,
 <matplotlib.patches.Rectangle at 0x0000000>,
 <matplotlib.patches.Rectangle at 0x0000000>,
 <matplotlib.patches.Rectangle at 0x0000000>,
 <matplotlib.patches.Rectangle at 0x0000000>,
 <matplotlib.patches.Rectangle at 0x0000000>,
 <matplotlib.patches.Rectangle at 0x0000000>,
 <matplotlib.patches.Rectangle at 0x0000000>,
 <matplotlib.patches.Rectangle at 0x0000000>,
 <matplotlib.patches.Rectangle at 0x0000000>,
 <matplotlib.patches.Rectangle at 0x0000000>,
 <matplotlib.patches.Rectangle at 0x0000000>,
 <matplotlib.patches.Rectangle at 0x0000000>,
 <matplotlib.patches.Rectangle at 0x0000000>,
 <matplotlib.patches.Rectangle at 0x0000000>,
 <matplotlib.patches.Rectangle at 0x0000000>,
 <matplotlib.patches.Rectangle at 0x0000000>,
 <matplotlib.patches.Rectangle at 0x0000000>,
 <matplotlib.patches.Rectangle at 0x0000000>,
 <matplotlib.patches.Rectangle at 0x0000000>,
 <matplotlib.patches.Rectangle at 0x0000000>,
 <matplotlib.patches.Rectangle at 0x0000000>,
 <matplotlib.patches.Rectangle at 0x0000000>,
 <matplotlib.patches.Rectangle at 0x0000000>,
 <matplotlib.patches.Rectangle at 0x0000000>,
 <matplotlib.patches.Rectangle at 0x0000000>,
 <matplotlib.patches.Rectangle at 0x0000000>,
 <matplotlib.patches.Rectangle at 0x0000000>,
 <matplotlib.patches.Rectangle at 0x0000000>,
 <matplotlib.patches.Rectangle at 0x0000000>,
 <matplotlib.patches.Rectangle at 0x0000000>,
 <matplotlib.patches.Rectangle at 0x0000000>,
 <matplotlib.patches.Rectangle at 0x0000000>,
 <matplotlib.patches.Rectangle at 0x0000000>]
- spacepy.plot.utils.smartTimeTicks(time)[source]
Returns major ticks, minor ticks and format for time-based plots
smartTimeTicks takes a list of datetime objects and uses the range to calculate the best tick spacing and format. Returned to the user is a tuple containing the major tick locator, minor tick locator, and a format string – all necessary to apply the ticks to an axis.
It is suggested that, unless the user explicitly needs this info, to use the convenience function applySmartTimeTicks to place the ticks directly on a given axis.
- Parameters:
- timelist
list of datetime objects
- Returns:
- outtuple
tuple of Mtick - major ticks, mtick - minor ticks, fmt - format
See also
- spacepy.plot.utils.timestamp(position=(1.003, 0.01), size='xx-small', draw=True, strnow=None, rotation='vertical', ax=None, **kwargs)[source]
print a timestamp on the current plot, vertical lower right
- Parameters:
- positionlist
position for the timestamp
- sizestring (optional)
text size
- drawBoolean (optional)
call draw to make sure it appears
- kwargskeywords
other keywords to axis.annotate
Examples
>>> import spacepy.plot.utils
>>> from pylab import plot, arange
>>> plot(arange(11))
[<matplotlib.lines.Line2D object at 0x49072b0>]
>>> spacepy.plot.utils.timestamp()