spacepy.plot.utils.annotate_xaxis
- spacepy.plot.utils.annotate_xaxis(txt, ax=None)[source]
Write text in-line and to the right of the x-axis tick labels
Annotates the x axis of an
Axesobject with text placed in-line with the tick labels and immediately to the right of the last label. This is formatted to match the existing tick marks.- Parameters:
- txtstr
The annotation text.
- Returns:
- outmatplotlib.text.Text
The
Textobject for the annotation.
- Other Parameters:
- axmatplotlib.axes.Axes
The axes to annotate; if not specified, the
gca()function will be used.
Notes
The annotation is placed immediately to the right of the last tick label. Generally the first character of
txtshould be a space to allow some room.Calls
draw()to ensure tick marker locations are up to date.Examples
>>> import spacepy.plot.utils
>>> import matplotlib.pyplot as plt
>>> import datetime
>>> times = [datetime.datetime(2010, 1, 1) + datetime.timedelta(hours=i)
...     for i in range(0, 48, 3)]
>>> plt.plot(times, range(16))
[<matplotlib.lines.Line2D object at 0x0000000>]
>>> spacepy.plot.utils.annotate_xaxis(' UT') #mark that times are UT
<matplotlib.text.Text object at 0x0000000>
(
Source code,png,hires.png,pdf)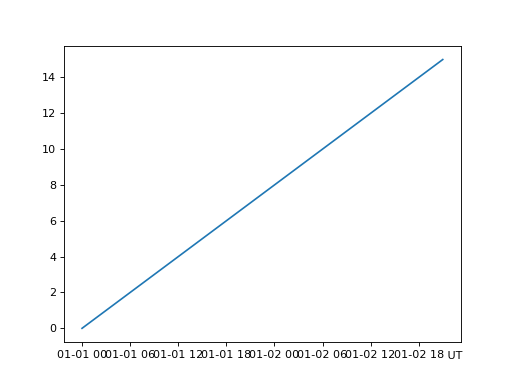